- Bid/Ask
- Posts
- A Comprehensive Guide to Uranium & Uranium ETFs
A Comprehensive Guide to Uranium & Uranium ETFs
Today’s research note will be covering the following topics:
Details about the top four uranium ETFs
The supply and demand outlook for uranium
Valuation by ETF
Sub-sector exposure by ETF
Mkt cap weight by ETF
Country exposure and liquidity
Utility stock valuations
Why Uranium
The current cyclical uranium bull market started all the way back in 2017, this was the year uranium inventories peaked and Japanese nuclear reactor restarts began accelerating after the 2011 Fukushima nuclear power station accident.
Commodities are characterized and defined by their cyclical nature, these markets are notoriously difficult for investors to consistently profit from.
Conversely, secular bull markets in commodities are what every commodity investor should be looking for - structural demand growth that overwhelms historical cyclical boom and bust cycles.
Nuclear power generation in America has been mired in a 40 year bear market, driven by public perception (Three Mile Island and Chernobyl) and project cost overruns and delays.
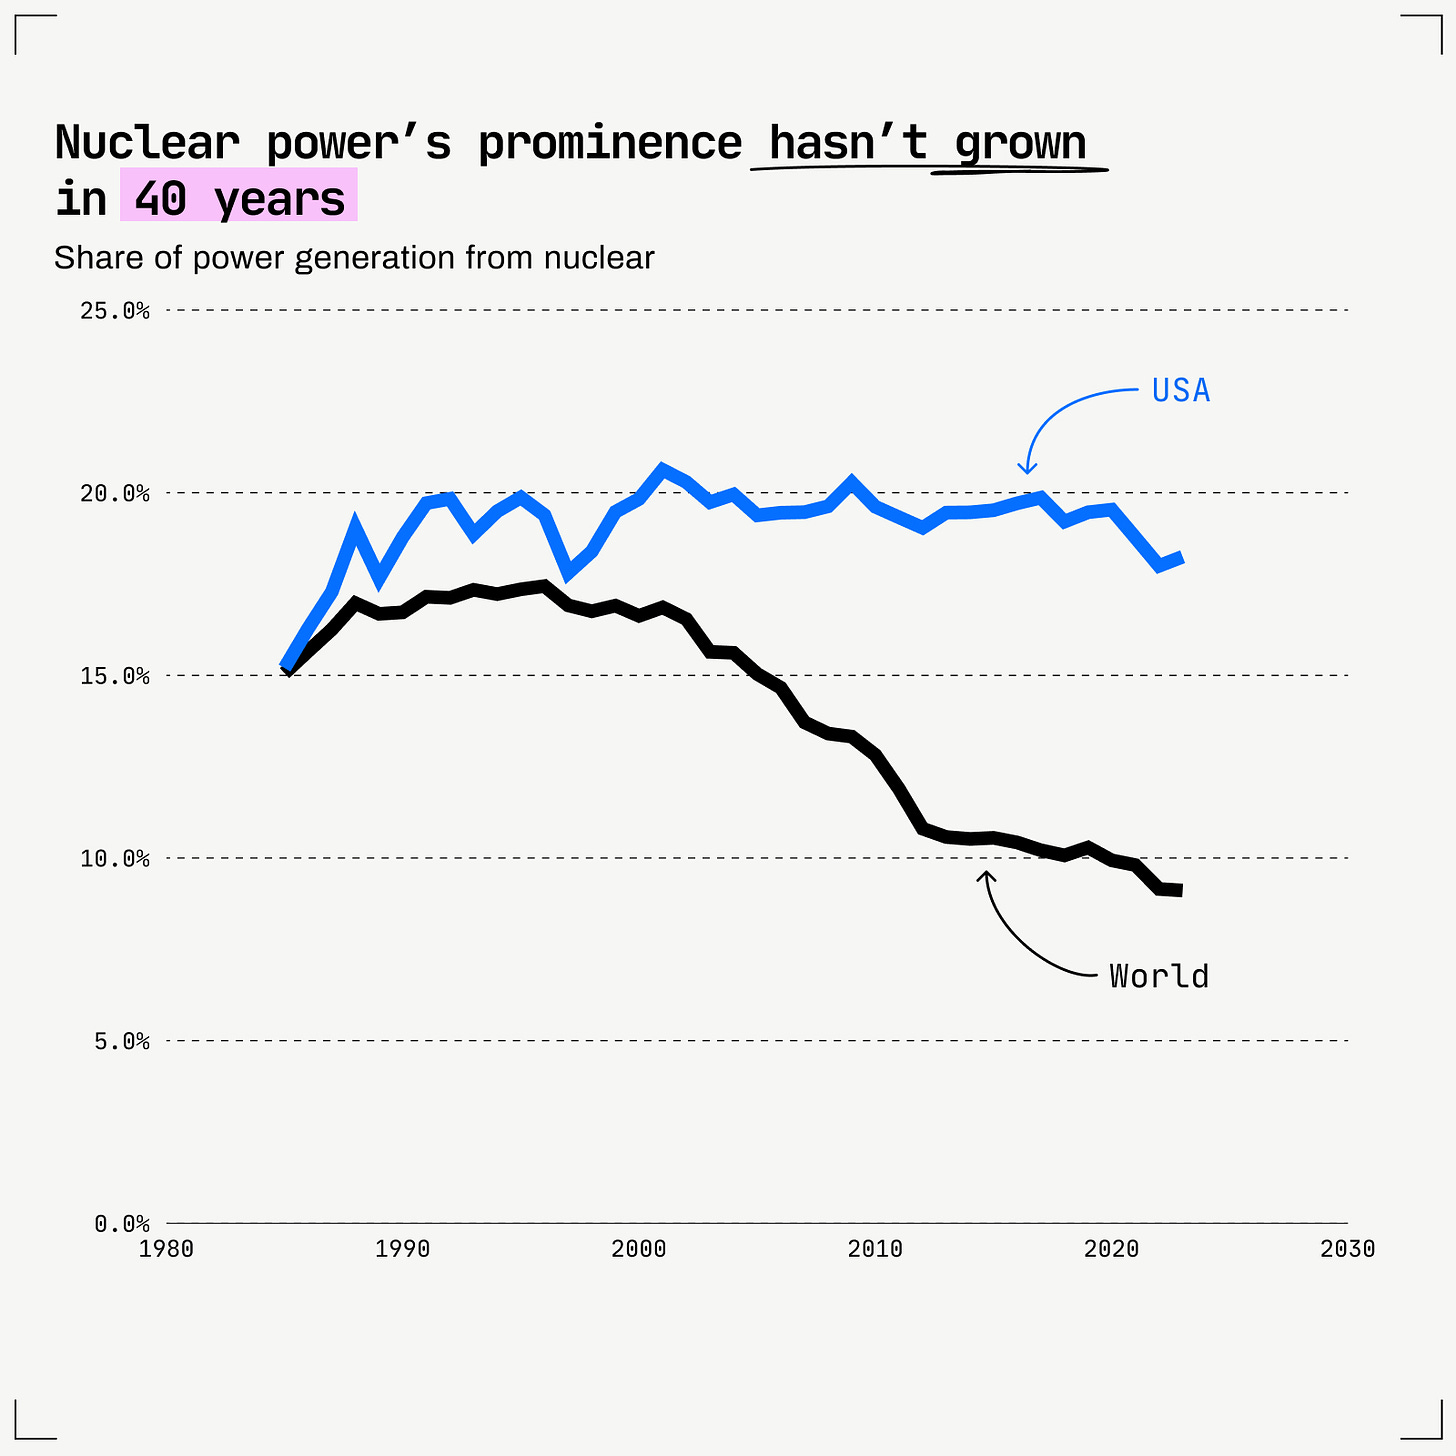
Source: Freethink
However 2024 will likely mark the year the secular uranium bull market was born.
Investor realization that massive amounts of new electricity will be needed to power an AI driven future, coupled with big tech companies announcing historic nuclear power investments has woken up governments and the public to the low carbon potential of nuclear energy once again.
The Investment Case for Uranium
The investment outlook for physical uranium and uranium miners looks bright, driven by a cyclical supply shortage and secular demand growth.
The secular demand growth story is powerful, but it will take time to play out, making the cyclical outlook far more important over the next 2-3 years.
In the here and now, as long as secondary uranium inventories are declining, prices should remain at levels that generate significant free cashflow for uranium producers.
Based on the most current supply and demand outlook according to IAEA and The World Nuclear Association, we have another 12-18 months of shortages and declining inventory before supply catches up to restocking demand from nuclear power plants.
Uranium Supply/Demand Outlook
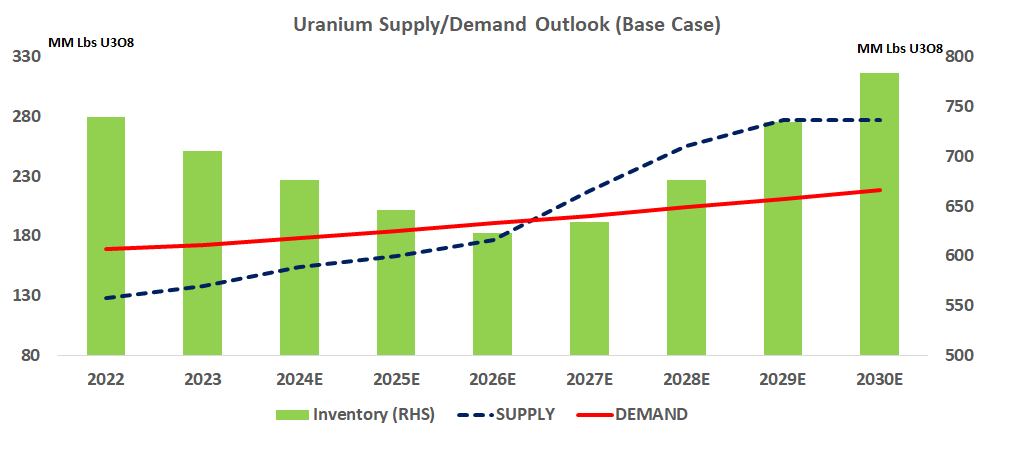
Source: Bid/Ask Estimates, World Nuclear Association, IAEA
Viewing inventory levels on years of supply instead, the current shortage really comes into perspective.
Fabricated and enriched uranium inventory is dangerously low, less than 6 months left when we exclude the coming year’s requirements, according to the IAEA.
Utilities generally prefer to hold three years of inventory at a minimum.
Shortages in enriched uranium will feed through into mined uranium (U3O8) as conversion and enrichment ramps up to rebuild inventories, drawing down stockpiles of U3O8 at an accelerating pace.
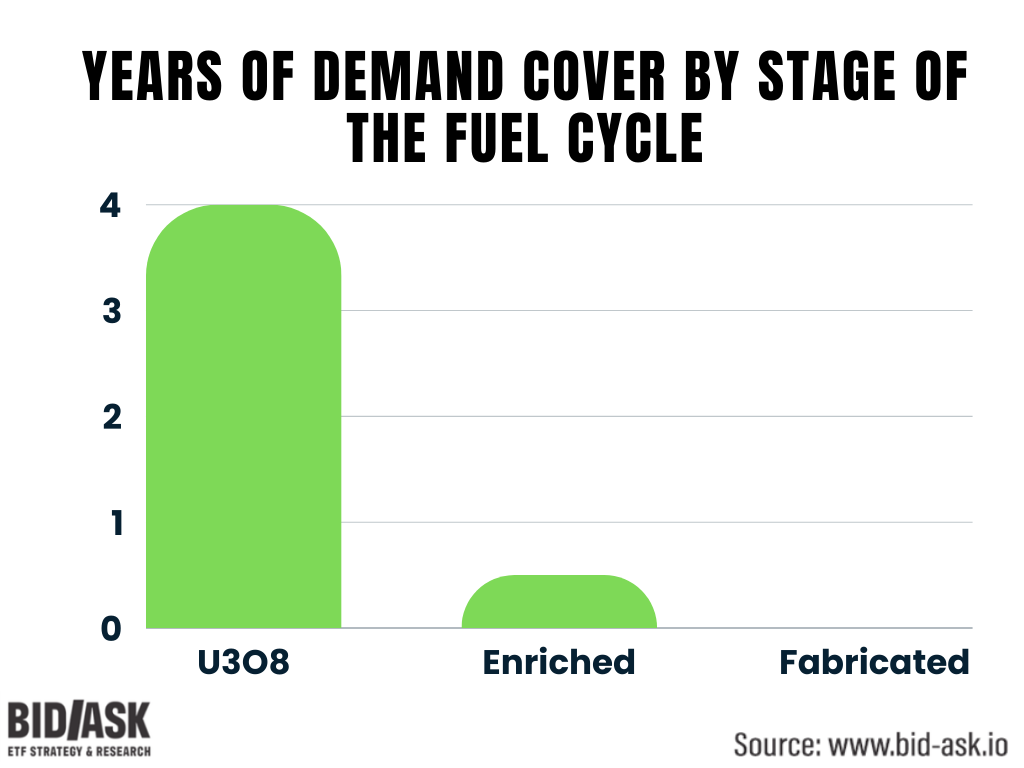
Source: World Nuclear Association
The Uranium ETFs: And Then There Were Four
Achieving diversified, low-cost exposure to uranium may seem straightforward on the surface with only four liquid uranium ETFs currently on the market, however, there are many important differences between each ETF.
We break down these differences below, including an analysis of the implied valuation of each ETF, key information we haven’t seen anywhere else.
Size
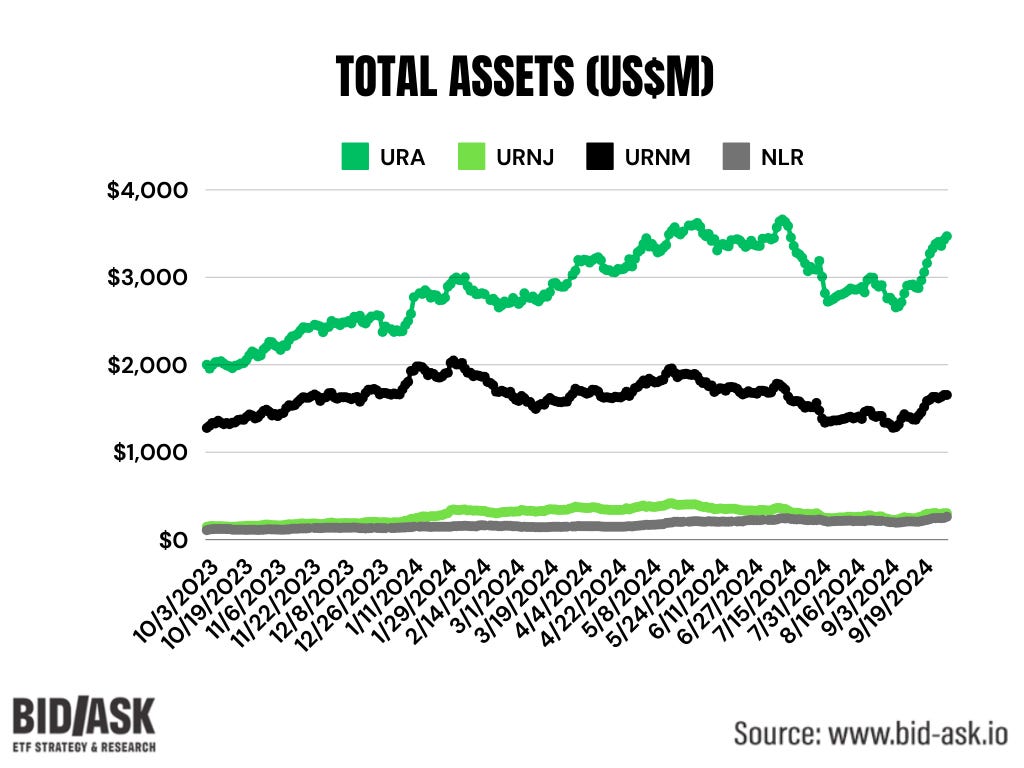
The largest fund by far is the Global X Uranium ETF (URA) at $3.5 billion. The other three funds are two run by Sprott (URNM & URNJ) at $1.6 billion and $300 million respectively and one by Van Eck (NLR) at $262 million.
The two smaller funds have gained the most assets over past 12 months on a % basis, but on a dollar basis, URA has added $1 billion, vs $280 million for the other three combined.
Now lets see if larger size also equals better liquidity…
Liquidity
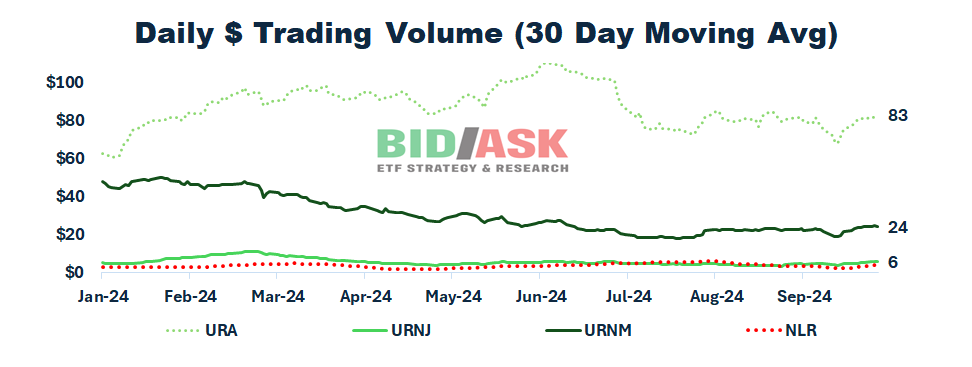
In the case of uranium funds, size equals volume. URA generates $83 million per day in trading volume with URNM at $25 million and both URNJ and NLR close to $6 million.
We want to stress that size and liquidity are far from the only factors you should consider when buying an ETF, but they are worth being aware of.
Sub-Sector Exposure
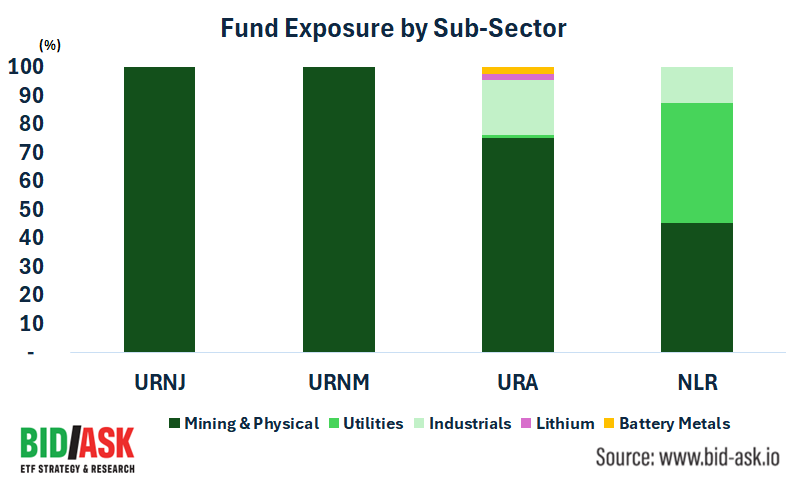
We wouldn’t fault you for assuming uranium ETFs exclusively own companies directly tied to uranium, but the reality is much different.
The largest ETF, URA, has 29% of the portfolio in companies that do not directly generate revenue from selling uranium. 25% is primarily in industrial companies involved in the construction of nuclear facilities with 4% oddly in companies mining lithium and battery metals.
NLR is even less concentrated with only 45% of the fund directly exposed to uranium sales. The fund owns 13% in heavy construction stocks and the remaining 42% in utilities like Constellation Energy (10% weight).
Visit our good friends over at the Idea Farm for more free, high value research.
Visit The Idea Farm Today
Uranium Fundamentals Matter
Even though all of these ETFs are passive and don’t actively pick winners and losers in the uranium space, they follow custom indices with very different levels of exposure across sectors, countries, market caps and valuation.
These ETFs all ignore valuation and focus solely on size and liquidity. While there are good reasons for owning liquid, larger names, we believe it’s short sighted to completely ignore the price per pound you’re paying.
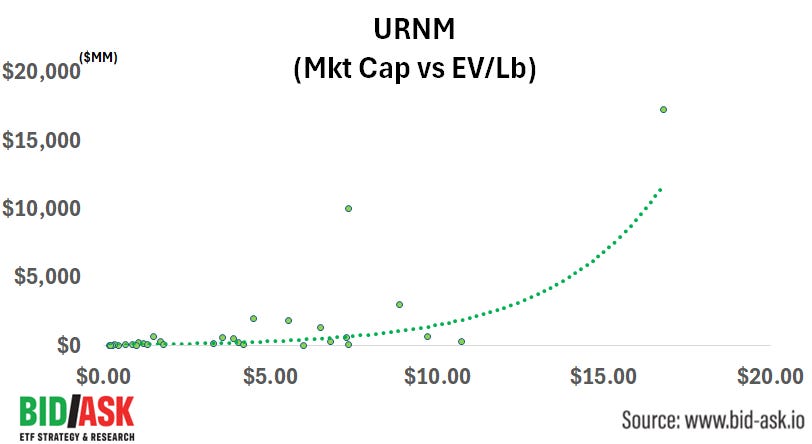
Using current stock market value and uranium resources by company, we calculated a weighted average EV/pound for each fund.
We weren’t surprised to see more large cap exposure equals a higher enterprise value per pound of resource.
If You Want to Own Large Caps You Have to Pay Up
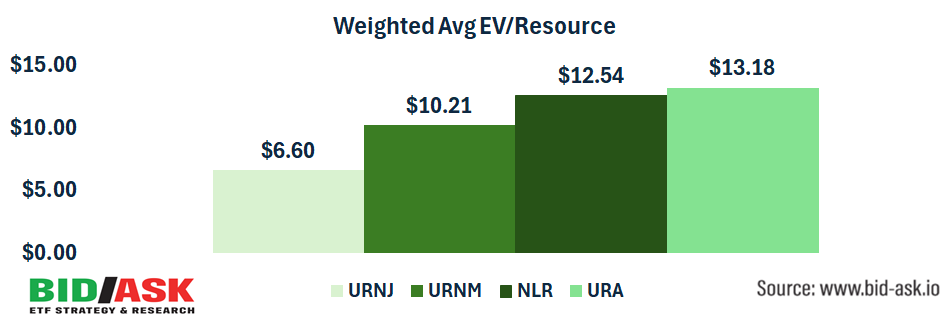
The mix of stocks also had an impact, but in general uranium valuations increase with market cap.
A Word on Utility Valuations
Even though an ETF like NLR has a lower EV/Pound than URA on the uranium miner holdings, don’t forget it also has a big slug of the fund in utility companies, owners of the nuclear reactors.
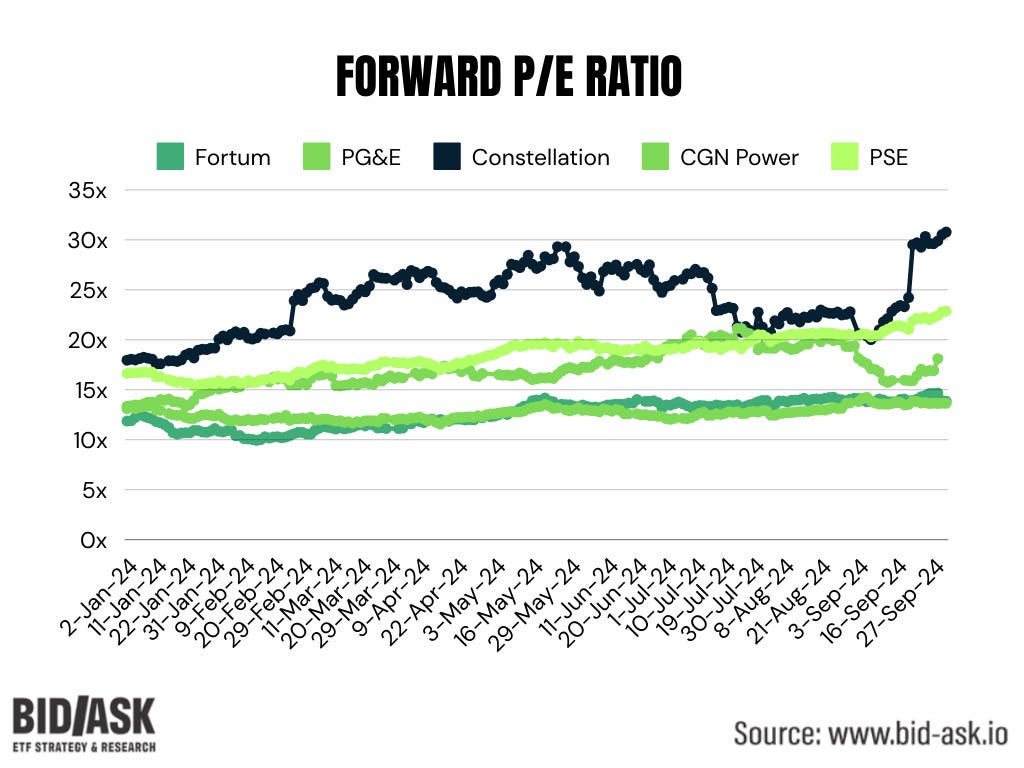
And utility valuations certainly look stretched, driven by hype around electricity demand from AI workloads.
Looking at the forward P/E according to Bloomberg consensus estimates, the utilities in the NLR fund have all seen significant valuation multiple expansion this year and are trading at a premium relative to historical multiples.
With 42% of NLR assets in expensive utilities and valuations on the mining names also elevated, the other three ETF’s look superior from a valuation standpoint.
Market Cap Exposure
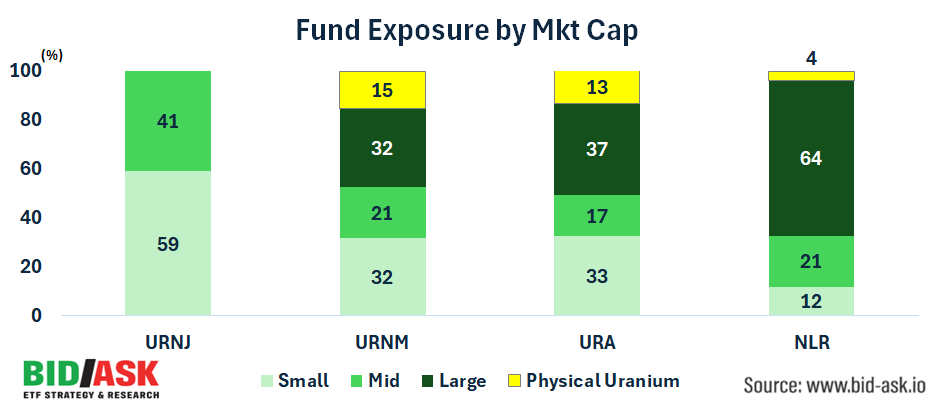
Differences among ETFs are also apparent when looking at exposure by market cap. It’s good to see URNJ is heavily weighted to small caps as the title implies, while URNM has chosen large weights for Cameco, Kazatomprom and physical uranium so the weight in mid and small cap miners is only ~50% vs 100% for URNJ.
URA’S higher weight in Cameco and large caps vs mid-cap explains the higher EV/Pound vs the Sprott products.
NLR is clearly highly geared to large cap industrials and utilities over uranium miners, making it a poor proxy for uranium exposure.
Country Exposure
Political risk is a serious consideration in Uranium with the increasing marginalization of Russia, a major player in uranium processing.
The US has already banned imports of Russian uranium, though is allowing nuclear fuel buyers to obtain waivers until the end of 2027.
While no ETF has direct exposure to Russia, there are lingering questions around how much influence if any Russia has on major producer Kazakstan.
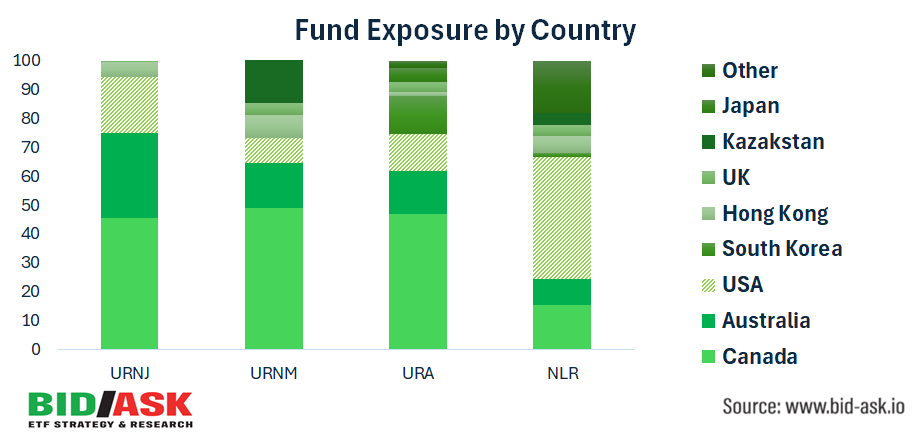
For those who prefer to stay far away from Asia, URNJ has the lowest exposure to the region, with 95% of assets in the USA, Canada, Australia and UK.
The other three ETFs are 78% (URNM), 90% (URA) and 72% (NLR) exposed to those four western countries.
From a theme point of view, owning URNJ is the purest bet on uranium demand moving west. URA and NLR offer similar exposure but more diluted due to low direct ownership in uranium miners. URNM also is a bet on western demand growth, though the 16% weight in Kazatomprom is something to be aware of.
Same Sector, Big Differences
Regular readers of Bid/Ask will notice a trend in the research we’ve put out; funds in the same sector, targeting the same investment themes can have very different holdings, volatility and most importantly return.
The goal of our bi-weekly analysis is to help investment advisors and astute retail investors better target exposures they really want, while avoiding the hidden risks of poorly devised indices and strategies within passive and active ETFs.
Given the secular nature of this uranium bull market, we’ll be following the ETFs in the space closely and will provide periodic updates to our readers.
Coming up Next: 0 Day Options
If you aren’t already a subscriber, now may be a perfect time to become one. For our next deep dive we’re pivoting to an insane corner of the market, zero-day option ETFs.
An area of the market that has been dominated by casino retail traders is seeing ETFs swoop in to capture alpha and harvest yield. We break down the strategies and assess their ability to generate attractive returns over time.
Join Bid/Ask to find out…