- Bid/Ask
- Posts
- $140 Billion of Tech ETFs are Broken in the Era of AI
$140 Billion of Tech ETFs are Broken in the Era of AI
Index Rules Gone Wrong
The value proposition for passive ETF index investing is straightforward: low cost, liquidity and market index performance – this is the unwritten promise between asset managers and the clients plowing $13 trillion into funds tracking indices.
The efficient market hypothesis (EMH) is behind the meteoric rise in passive investing, now the dominant force in investment management.
EMH is the view that the market always knows best. If you can’t beat the market (ie. active investing) the most prudent thing to do is to join it.
Money in Passive Funds Now Equal Active Funds
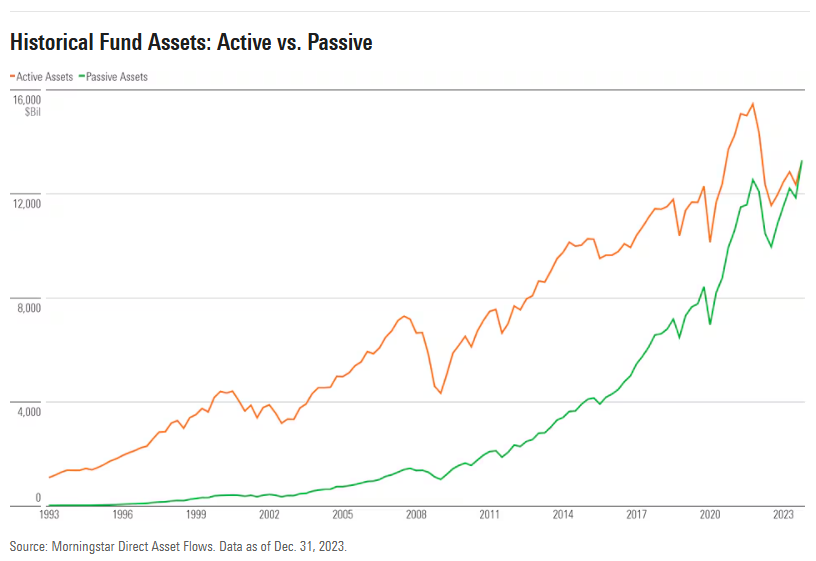
The marketing of these passive ETFs has benefitted from the simplicity of the messaging, deliver market-based returns for a low fee - nothing less, nothing more.
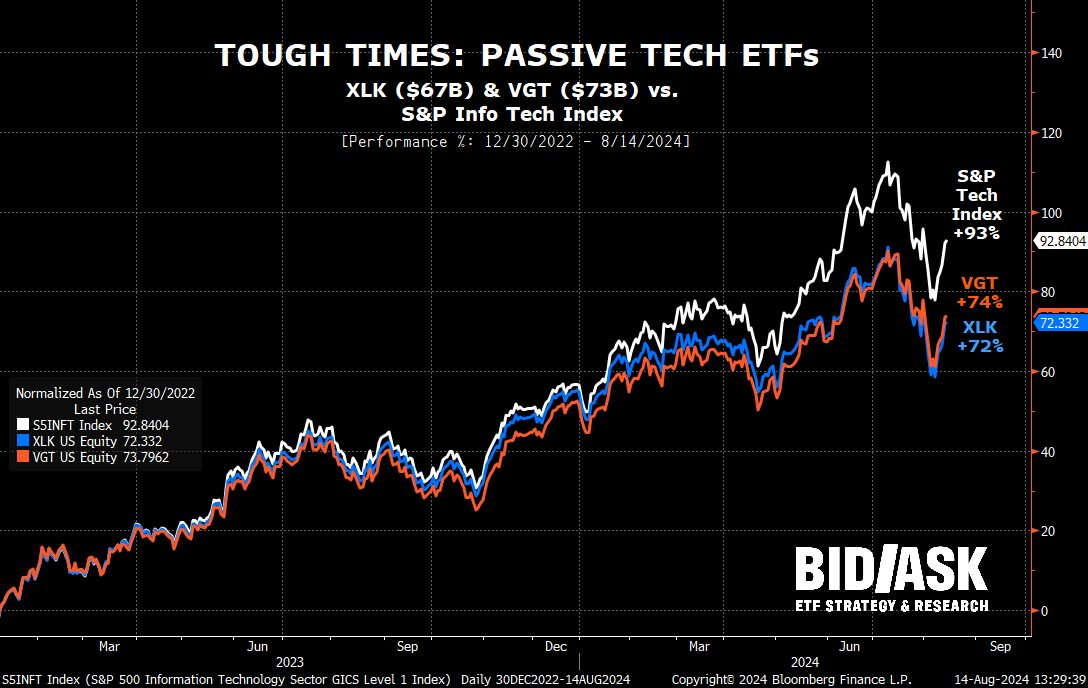
However, investors owning passive technology ETF’s, a multi-billion dollar slice of the market, aren’t getting the ‘passive index returns’ advertised on the tin. $146B of technology ETFs are broken in the era of AI, underperforming the index they were supposed to track by as much as 20% since the beginning of 2023.
When Passive Returns Aren’t Up to Snuff
Since the AI boom began (January 2023), 3 of the 4 largest passive diversified technology ETFs ($146B in assets) have underperformed the main benchmark, the market cap weighted S&P 500 Information Technology Index.
These ETFs have underperformed over this period not just by a little, but by a whole lot.
The Technology Select SPDR ETF, Vanguard Information Technology ETF and Fidelity MSCI Information Technology ETF have underperformed the index by 20%,18% and 17% respectively.
The iShares US Technology ETF is the lone fund to keep up with the index.
Relative Performance of the Largest Tech Funds vs S&P Technology Index (2023-August 2024)
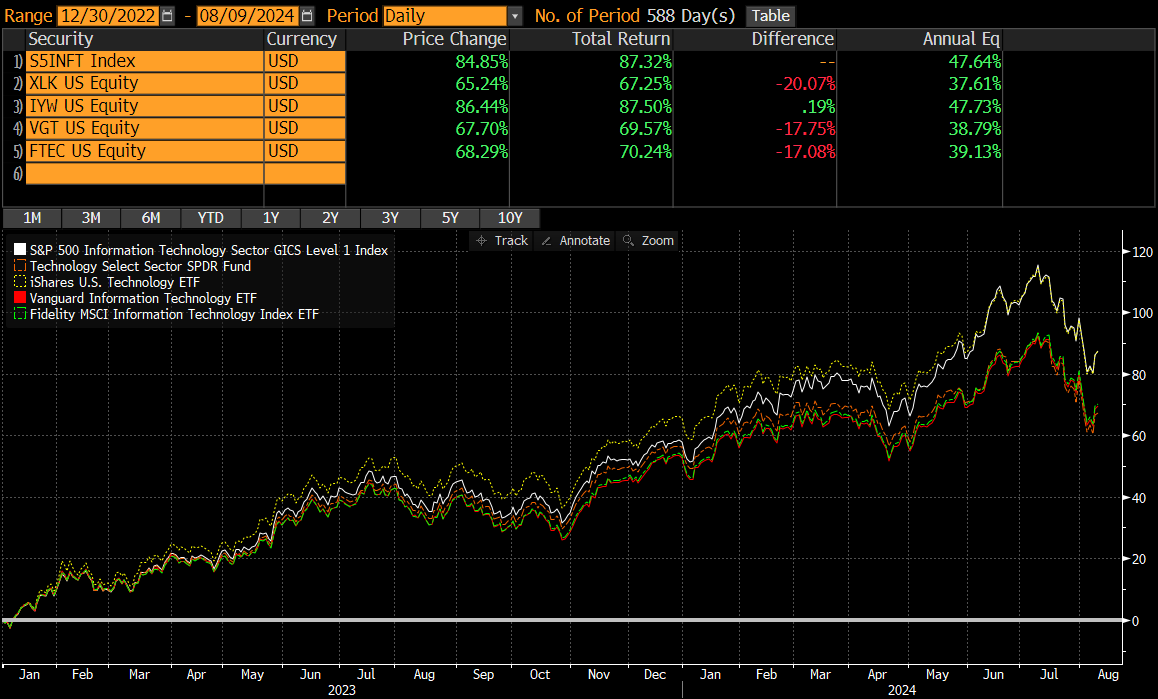
The obvious question is why?
For an industry that should be plain vanilla (market cap weight the holdings), these levels of significant underperformance should warrant plenty of concern for the fund’s investors.
The answer: A perfect storm of mega-cap tech concentration colliding with regulatory rules; with each tech ETF navigating these forces differently, generating very mixed results.
Tech ETFs are Getting Tripped Up on Mega-Caps
Analyzing the performance attribution of the top three diversified technology ETFs (XLK, VTG & IYW) vs. the S&P Tech Index, the largest drag by far comes from not owning enough Nvidia.
Technology Select SPDR ETF (XLK, $68B AUM): Underweight in Nvidia cost the fund 13%
Vanguard Information Technology ETF (VTG, $73B AUM): Underweight in Nvidia cost the fund 9%, while their off-benchmark positions in Visa & Mastercard detracted a further 5%.
iShares US Technology ETF (IYW, $18B AUM): Underweight in Nvidia cost the fund 6%, while their off-benchmark positions in Google and Meta added 4%.
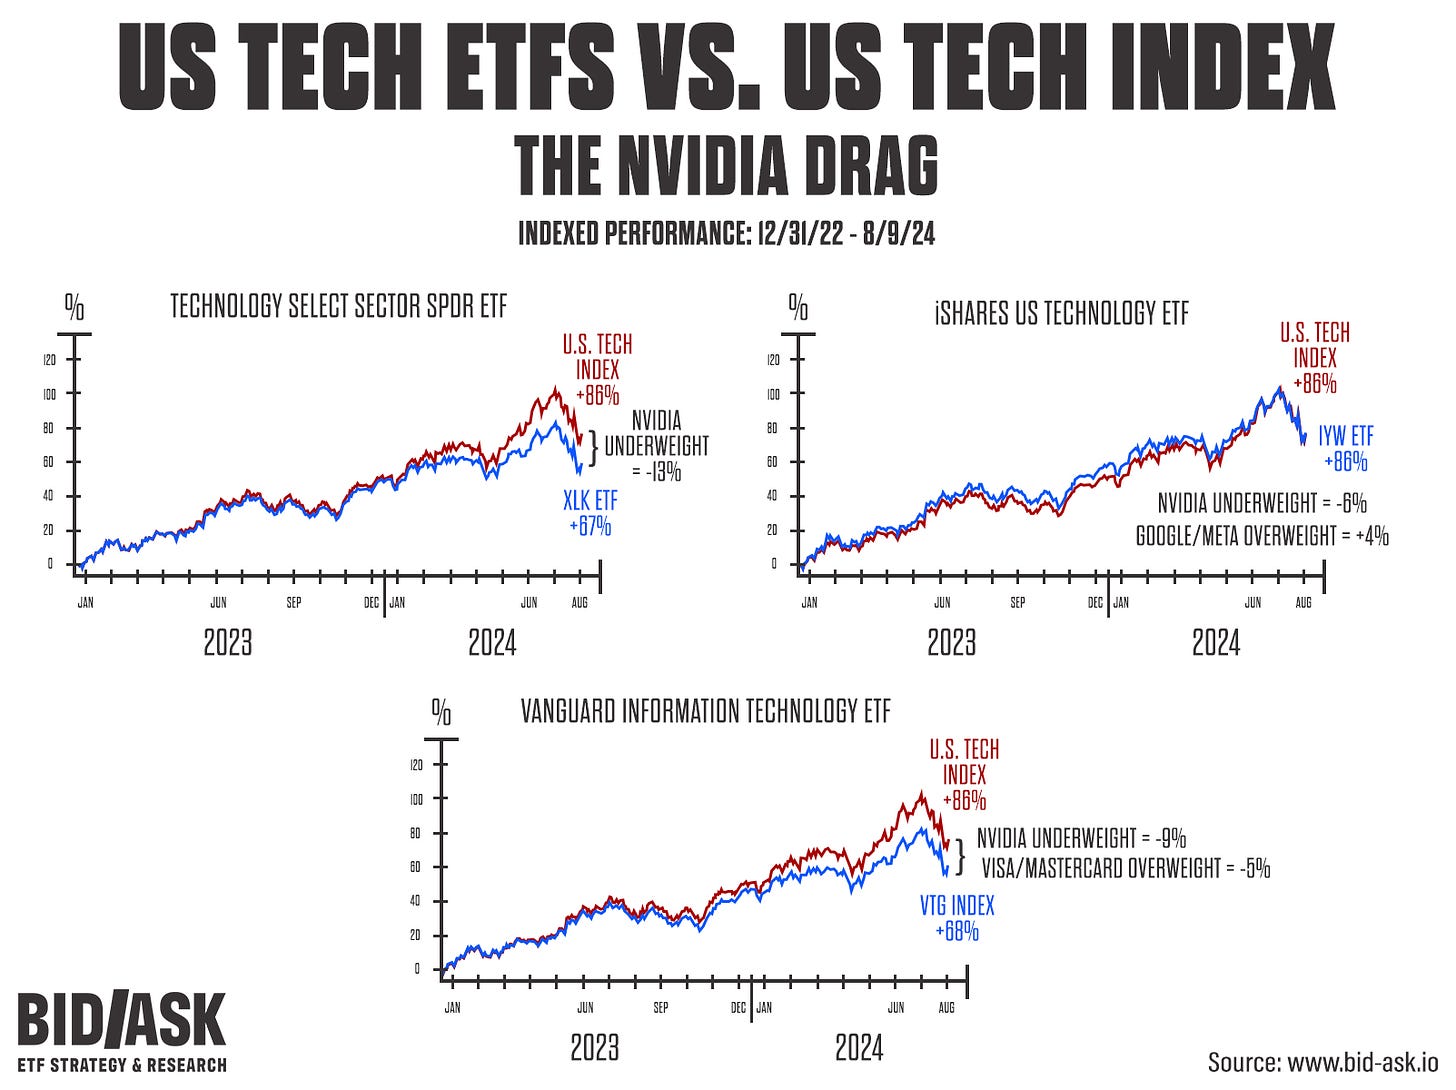
The performance attribution clearly highlights something has gone off the rails in passive technology investing. Key questions investors should be asking:
Why has the Nvidia performance drag varied so much for funds that are supposedly all tracking the same industry on a market cap weighted basis?
Why are passive technology ETFs owning stocks that are outside the technology sector? Google & Meta are in the Communications Services sector, while Visa & Mastercard are in the financial sector.
These are big differences between passive sector funds that should effectively have very similar company names and weights.
Over the last 18 months assets flowed to these ETFs as investors have sought to gain thematic exposure to artificial intelligence (AI), however these significant difference in holdings has led to widely varying sub-sector exposures among mega cap tech stocks.
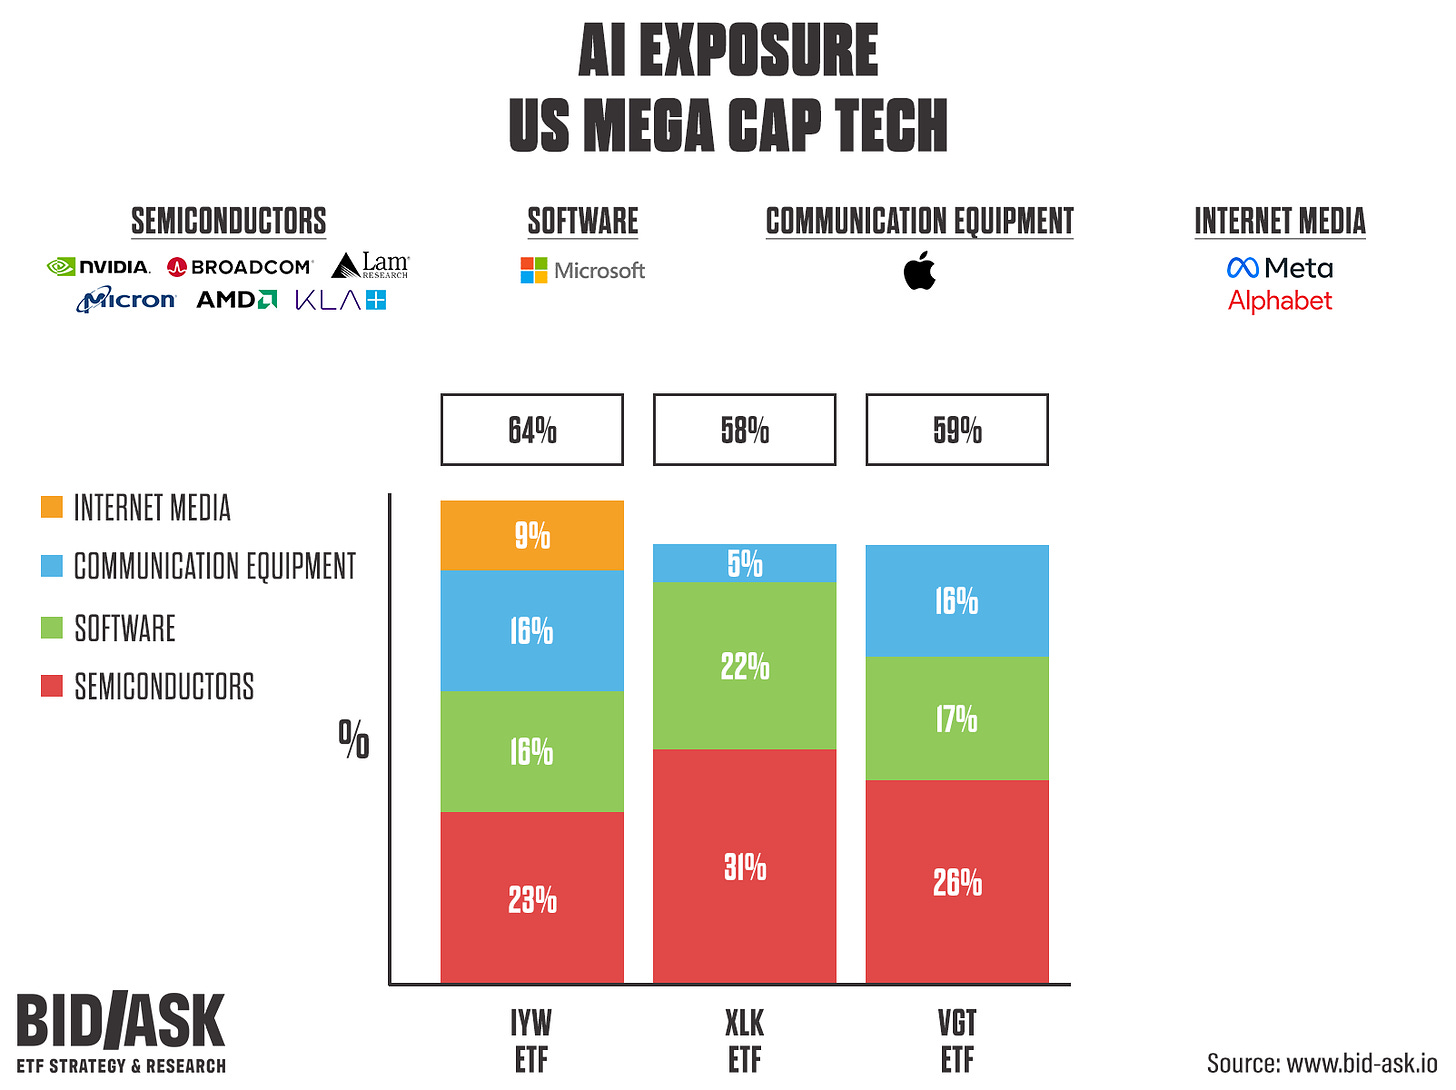
The weight differentials among ETFs in the semiconductors, software, communications equipment and internet media sub-sectors could certainly lead to continued big performance differences among these funds and relative to the market cap weighted index.
The Nvidia performance drag across all the passive ETFs is related to a historic SEC regulatory rule that limits the top 3 holdings in an ETF to a 50% weight in the overall fund. The mega cap era of technology has tripped this rule.
Bottom Line: The more concentrated the stock market becomes with the mag 7, the more these funds will underperform the index due to these SEC diversification rules.
Of all the funds subject to this rule, the iShares Technology Select SPDR ETF (XLK) is the fund raising the greatest number of red flags, earning it an entire section of this report.
XLK - When Index Rules Go Very Wrong
The iShares Technology Select Sector SPDR ETF (XLK) is a passive juggernaut. $70 billion dollars invested by retail investors and advisors who think they are closely tracking an index of technology stocks in the S&P 500.
But the index XLK tracks, the S&P Technology Select Sector Index, uses a capped weighting methodology, a decision that has critical implications for how the index and the fund behave.
In jargon free terms, the technology select index must keep the top 3 positions under 50% of the portfolio to be in line with SEC fund diversification rules.
You would think S&P would have the top 3 positions at similar weights over time, but instead they’ve made an arbitrary weighting rule that has driven significant underperformance and volatility recently.
Each quarter the S&P committee looks at the fund weights of any position above 4.8% in the index. The 2 stocks with the highest weights are typically left alone as long as they aren’t more than 24% of the index. However the stock with the 3rd highest uncapped weight is cut to 4.5% of XLK regardless of its weight in XLK prior to the rebalance.
Massive Underperformance Ensues
Unfortunately for XLK investors, the weighting scheme devised by the S&P committee has been a disaster for performance ever since the rise of AI.
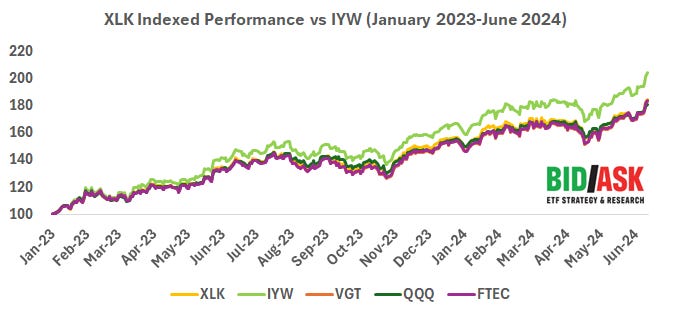
Comparing XLK to other S&P technology ETF’s that don’t cap weights, or cap them more evenly across the top 3 positions, you can see the stark difference between Jan 2023 vs. early June 2024, just before XLK went through a dramatic rebalance explained more below.
While Nvidia was allowed to run in these other funds, XLK kept reducing the weight to 4.5% the whole way up, driving significant underperformance.
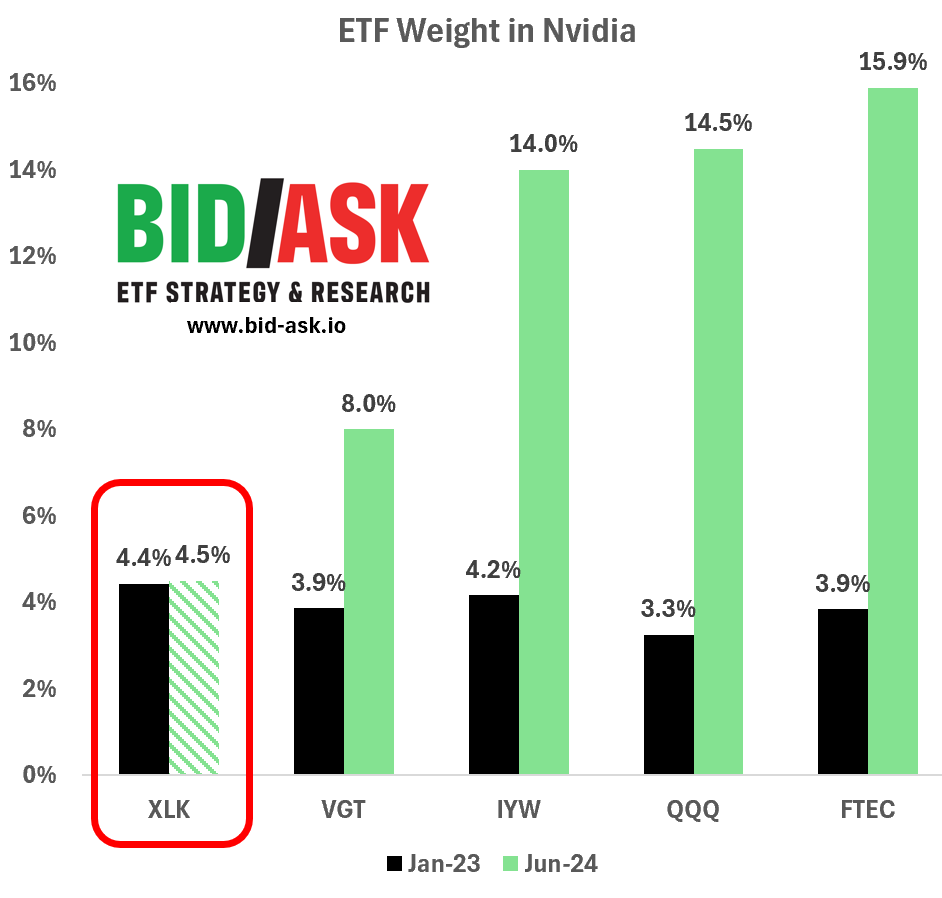
XLK suffered for it, underperforming an uncapped fund like the iShares US Tech ETF (IYW) by 20% over 18 months. And IYW has 214 positions vs XLK’s 67.
Buyers of XLK thought they were getting diversified technology exposure, but in reality, they were making a huge bet in favor of Apple and Microsoft over Nvidia.
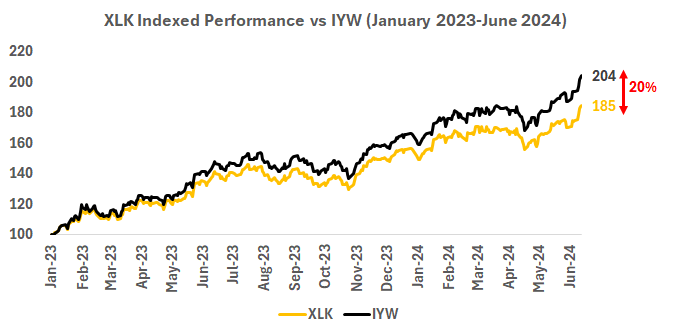
10 Billion of Weighting Changes in a Single Day and More to Come?
Due to Nvidia’s big moves through early June Nvidia’s weighting in the uncapped index, which determines rebalances, was 2nd highest, above Apple, even though NVDA was still only 5.9% of the XLK ETF.
This caused XLK to cut Apple’s weight to 4.5% from 21% and raise Nvidia’s from 5.9% to 21%, a massive trade for XLK. This trade, executed in late June, moved $10 billion from Apple to Nvidia in a single day, 70% and 20% of Apple and Nvidia’s daily volume respectively.
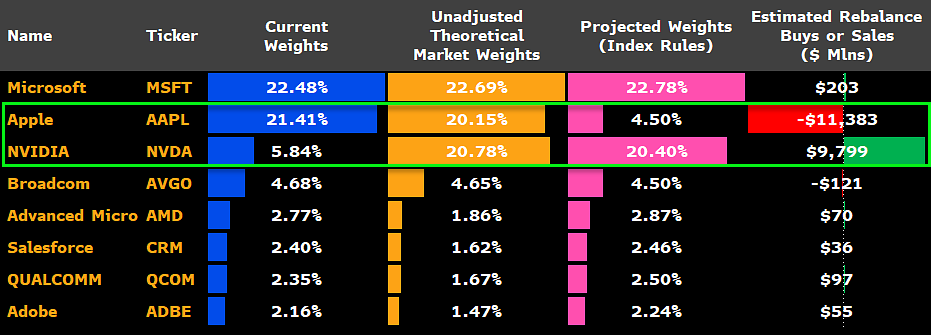
Source: Bloomberg
This is a case of an index rule gone amuck, 15% swings in security weights in a single day rarely happen, even in active fund management.
With Nvidia down ~7% and Apple up ~7% since the June 21st rebalance, XLK investors are once again taking it on the chin.
XLK in White (June 21st to August 14th)
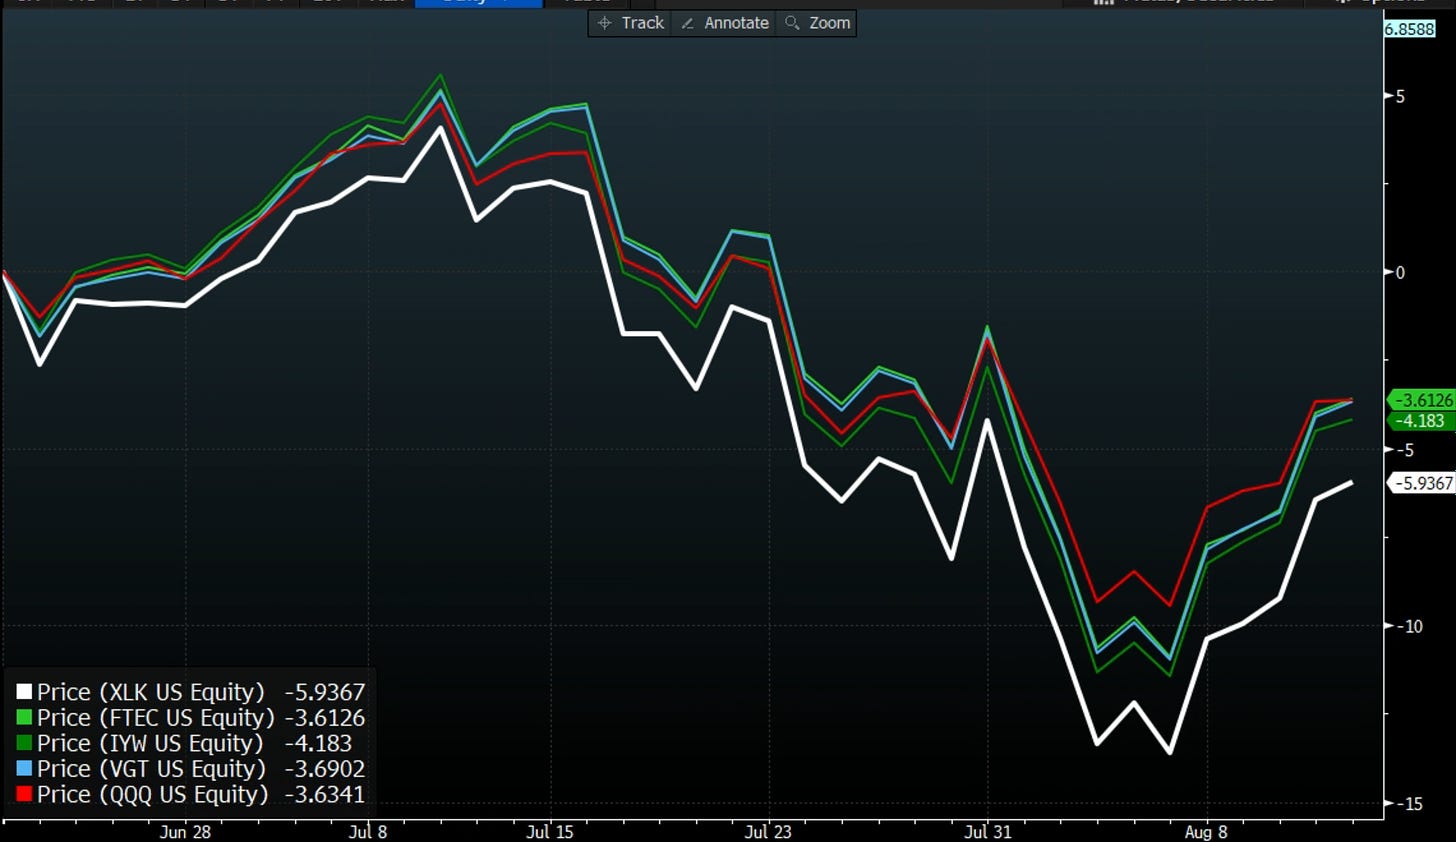
And a big rebalance like what we saw on June 21st could happen again soon, depending on how Apple, Microsoft and Nvidia perform.
If Apple rises enough over the next few months while Nvidia falls, it could trigger a cut to Nvidia back to 4.5% and billions in buying of Apple.
On top of the big weighting swings, because the S&P makes rebalance changes public before they happen, XLK shareholders are exploited by hedge funds who front run the rebalance. Nvidia outperformed Apple by 8% from June 11th-18th and then underperformed by 3% in the 2 days leading up to the rebalance.
In the view of Bid/Ask, if an investor is seeking to own a passive technology fund (ie. market cap based returns) they certainly don’t want the baggage that comes with XLK’s capped weighting scheme.
Periodic 15% swings in the weights of ETF holdings is the literal anthesis of passive investing.
Transparency is a hallmark of passive index investing, however investors won’t find that with XLK. The ETF tracks an index run by a committee with no publicly available investment strategy.
If you think you’re getting disclosure from S&P on how they arrived at these major index rules and changes, you’ll be waiting a while.
Quoting S&P DJI’s own documents:
They do not comment on potential changes
S&P believes index changes are market moving therefore the index committee discussions remain confidential even after the change has been made.
S&P reserves the right to change the index rules at any time


Instead of owning XLK, funds like IYW, FTEC or VGT look like better alternatives… They’re more diversified across technology and apply the capping rule evenly across the top 3 positions. You won’t see the weights of Nvidia, Apple and Microsoft fluctuating 15% in a day like with XLK.
Critically, IYW is the only fund with exposure to the Internet & Media subsector, which includes Meta and Google, major players in the AI race. If you believe in the potential of AI.
Potential Alternatives to Owning XLK

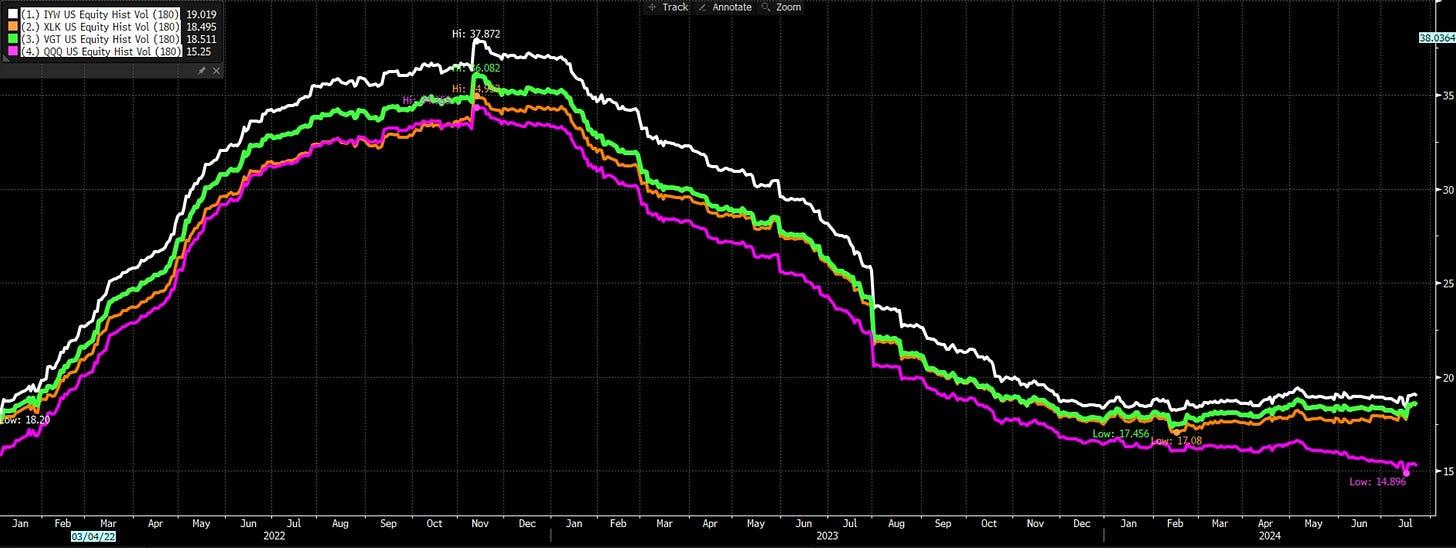
6 Month Volatility by Fund (IYW=White, XLK=Orange, VGT=Green, QQQ=Pink)
IYW
Blackrock’s iShares US Technology ETF is especially unique among the group. It is well diversified but still more concentrated then Vanguard or Fidelity’s offerings with 140 positions.
Most importantly, IYW is the only large passive technology fund that owns Meta and Google which surprised us. These are two of the largest players in AI, a major technology innovation, yet they are unowned by most of the largest passive tech ETF’s on the market.
The fee is higher than other options but IYW has significantly outperformed the other funds since the market started to appreciate the potential of large language models in early 2023. We are talking 0.30% of extra annual fees against 20% of outperformance vs XLK.
VGT
The Vanguard Information Technology Index Fund is the cheapest, not a surprise with a Vanguard product, but is the most diluted with over 300 positions. Looking at performance over the last two years these extra positions have hurt not helped the fund, and have not lessened drawdowns vs the other funds (See comp table above).
VGT is also more weighted than peers to small cap tech. The median mkt cap is $10 billion vs $46 billion for XLT.
Bid/Ask: There’s Much More Sleuthing to be Done
If you think a $70bn “passive” ETF swinging 15% of assets in one day is wild… we’re just scratching the surface of sloppy index rules and outright mismanagement - the rabbit hole goes deep.
Subscribe to Bid/Ask as we continue to shine a data driven analytical lens on the ETF industry.